OEE Dashboard
Overall Equipment Effectiveness (OEE)
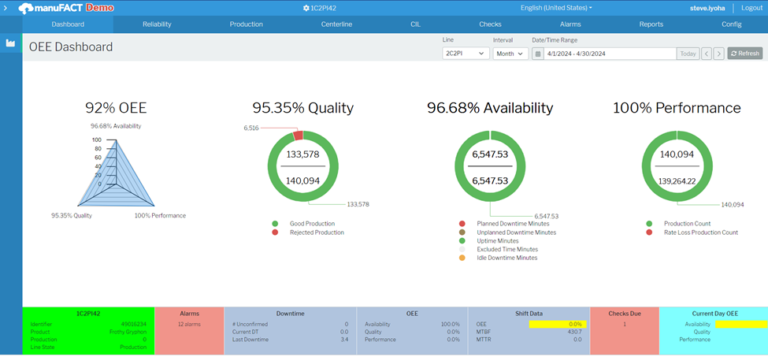
The System Dashboard provides a real-time overview of Overall Equipment Effectiveness (OEE) and its three components: Quality, Availability, and Performance.
Key Features
Comprehensive OEE Tracking
Real-time monitoring of Overall Equipment Effectiveness (OEE)
Breakdown of OEE into Quality, Availability, and Performance metrics<
Breakdown of OEE into Quality, Availability, and Performance metrics<
Real-Time Data Visualization
Instant access to live production data
Detailed visual insights into production line performance
Detailed visual insights into production line performance
Intuitive User Interface
Easy-to-read graphical representations
Calculations explained simply
Calculations explained simply
Benefits
Increased Efficiency
Streamlined operations with immediate access to critical production data
Quick decision-making based on real-time insights
Quick decision-making based on real-time insights
Improved Productivity
Enhanced ability to maintain optimal production levels
Reduction in production delays and increased throughput
Reduction in production delays and increased throughput
Higher Quality Products
Proactive quality management leading to fewer defects
Consistent production of high-quality goods
Consistent production of high-quality goods
Visual Components
OEE Overview
Summary view of overall equipment effectiveness with access to historical dat
Quality Control Charts
Visual representation of quality metrics
Visual comparison of good production vs reject production
Visual comparison of good production vs reject production
Availability Status
Real-time machine availability and access to downtime logs
Visual representation of uptime vs downtime
Visual representation of uptime vs downtime
Performance Analysis
Performance trends and comparison against production goals
Track your target production vs cumulative production to visualize rate losses
Track your target production vs cumulative production to visualize rate losses


